Economy (data and information)
Economic comparison through GDP’s evolution
Brazil, Russia and India had in 1978, at market prices, a GDP of 1 billion dollars, seven times the one which China had (0.14 billion dollars). In 2011, the Chinese GDP (7.31 billion dollars) exceeded by 12% the GDP of those 3 countries all together (6.17 billion dollars). The GDP of China and that of India were practically the same in 1978; in 2011, the Chinese GDP (7.31 billion dollars) quadrupled the Indian (1.84 billion dollars). In 1978 Brazil's GDP (0.2 billion dollars) almost doubled that of China (0.14 billion dollars); in 2012, the Chinese GDP (8.25 billion dollars) more than tripled the Brazilian one (2.42 billion dollars).
Much more dramatic is the comparison between China and Russia, due to the disintegration of the Soviet Union in 1991. Suddenly the GDP controlled by Moscow collapsed by half; the other half was distributed among the fourteen new independent states, until then Soviet republics. In 1990, the GDP of the USSR tripled that of China; in 2011, Chinese GDP quadrupled Russian one, which was somewhat higher than India's. That is to say, if the GDP controlled by Moscow in 1991 was 300% of that controlled by Beijing, in 2012 it had become only 25%. And the difference will be enlarged, while the growth of China exceeds that of Russia, as is the case in China's relationship with the other BRICS.
In conclusion, China has become a great power, only comparable to the United States. In 2050 China's GDP will be between 35% (according to Price Waterhouse Coopers) and 70% (according to Goldman Sachs) higher than United States’ one. (Antonio Blanc, 2015)
 (Source: World Bank; World Economic Outlook, October 2012)

Glancing these datasets/graphics for a while we will easily come to the conclusion that China can’t be compared at all with the other BRICS countries. According to the data, China’s economy is much more powerful than Indian or Brazilian ones. In addition, all the estimations and forecasts state that this trend will even enlarge in the future.
Economic sectors
China is the dominant world manufacturer and strong service provider. It is already the world’s second largest economy and promises soon, as we already mentioned, to surpass that of the United States. As such, it shadows the rest of the BRICS. India has a stronger position in the service supply category, Russia is a world-class raw materials supplier, as is Brazil, although Brazil is also a significant provider of manufactured goods and services, South Africa’s is a much smaller economy and mainly serves as a strategic (African) partner rather than an equal economic power partner in the group. (Pasquale Pistone, 2015)
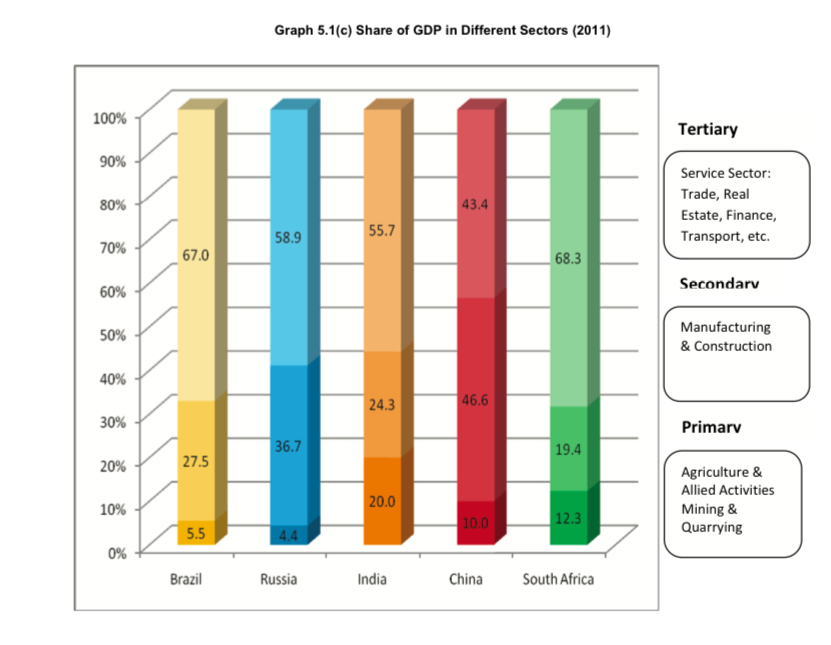
In the following graphic we can see the GDP's percentage which is dedicated to each economic sector in every BRICS country.
We can see that Brazil, Russia, India and South Africa produce more than 50% of their GDP in the tertiary sector. At the same time, the primary sector is the one which produces less wealth in all the BRICS countries.
Tax treaties
When it comes to economic relations, tax treaties are essential to make these relations possible and successful. These treaties ensure the swaps, the exportations and the importations between countries.
Brazil is the BRICS country with less treaties. In the first stage, Brazil was mainly a capital-importing country, and therefore treaties were focused on traditional investors. Although Brazil began entering into tax treaties in the 1960s and there is a tendency to reverse or at least to reduce such an approach, the country’s tax treaty network is not significant when compared to international practice or to other countries in the BRICS group, the members of which each have concluded approximately 80 treaties. By contrast, Brazil has only 32 tax treaties in force. (Luís Eduardo Schoueri, 2015)
On the other hand, Brazil is the only country in the American subcontinent that keeps strategic relations with the EU. The European Union is the main economic partner of Brazil; Brazilian exports to the European market represent 27% of the total Brazilian exports (basically raw materials and especially food).
Agricultural exports are the fundamental asset of Brazil and the Mercosur countries.
The EU is also Russia's first trading partner, and Russia is the EU's third trading partner. The EU is also the main investor in Russia, actually the origin of approximately 75% of foreign investment in that country.
Energy supply from Russia to the EU in 2013 represented 35% of oil imports, 30% of natural gas imports and 26% of solid fuels. Six of the member states depend on Russia as the only supplier of its gas imports.
Exportations and importations
The economic relations between countries (mainly the exportations and the importations) are directly related with the treaties which are in force. It would be interesting to take a look to the BRICS' partners when it comes to this field.


Example: Russian treaty network with regard to the regions of the world (1)
In recent years, Russia has pursued a quite an active international tax policy, signing 88 income tax treaties. At present, Russia has 80 tax treaties in force (including two tax treaties -those with Malaysia and Japan- concluded by the former USSR which are still applied by Russia); in addition, several tax treaties have been negotiated and signed but not ratified by the Federal Assembly.
Russia has tax treaties in force with 27 EU Member States. Estonia is only EU Member State with which no tax treaty is in force. Also, there are eight treaties with European countries that are not EU Member States, namely Albania, Iceland, Norway, Switzerland and successor states of the former Yugoslavia (Croatia, Macedonia, Montenegro and Serbia).
Russia also has tax treaties with all but one of the Commonwealth of Independent States (CIS) countries (all except for Georgia); these agreements with all the CIS countries include the exchange of information and the assistance in the collection of taxes. In addition, Belarus, Kazakhstan and Russia are also members of the Eurasian Customs Union.
When it comes to Asia, Russia has quite a wide network of tax treaties with non-CIS Asian countries. In particular, there are 21 treaties in force. The network of tax treaties with Asian countries includes major players such as China, India and Indonesia, as well as other countries such as Iran, Israel, Korea, Kuwait, Lebanon, the Philippines, Qatar, Saudi Arabia, Syria, Thailand, Turkey, Singapore, Sri Lanka and Vietnam, and even rare signatories of tax treaties such as Mongolia and North Korea.
The Russian tax treaty network with African countries is not wide, and includes Algeria, Botswana, Egypt, Mali, Morocco, Namibia and South Africa.
Australia and New Zealand have tax treaties with Russia as well, and some Pacific islands such as Fiji are still trying to achieve one.
In North America, Russia has tax treaties with Canada and the United States (the tax treaty with the United States is one of the first tax treaties concluded by Russia after the disintegration of the Soviet Union). In Latin America, several tax treaties are in force, namely Argentina, Chile, Cuba, Mexico, Venezuela and Brazil (effective internally since 2017).
1. BRAUNER, Y and PISTONE, P. BRICS and the emergence of international tax coordination. Amsterdam: IBFD, 2015. Pag. 87-91

Comments
Post a Comment